Sign In
Sign In

Cloud Server

Deploy your cloud server in minutes and experience the freedom to scale your
infrastructure effortlessly. Fast, secure, and flexible cloud server solution
designed to meet your unique needs without the constraints of traditional
servers.
Contact Sales
Hostman Cloud
Blazing 3.3 GHz Processors
& NVMe Disks
Experience unparalleled speed with processors optimized for demanding applications, combined with ultra-fast NVMe disks for quick data retrieval.
200 Mbit Channels,
Unlimited Traffic
Enjoy stable, high-speed connectivity with unthrottled traffic, ensuring smooth performance even during peak usage periods.
24/7 Monitoring
& Support
Stay worry-free with round-the-clock monitoring and professional support, ensuring your systems are always operational.
Cost-Effective
Management
Our cloud server solutions are designed to deliver maximum value for your money, offering flexible pricing without compromising on performance.

Cloud server pricing

We offer various cloud server plans, tailored to your exact needs.
Get the best performance at a price that fits your budget.
New York
1 x 3 GHz CPU
CPU
1 x 3 GHz
1 GB RAM
RAM
1 GB
25 GB NVMe
NVMe
25 GB
200 Mbps Bandwidth
Bandwidth
200 Mbps
Public IP
$4
 /mo
1 x 3 GHz CPU
CPU
1 x 3 GHz
2 GB RAM
RAM
2 GB
40 GB NVMe
NVMe
40 GB
200 Mbps Bandwidth
Bandwidth
200 Mbps
Public IP
$5
 /mo
2 x 3 GHz CPU
CPU
2 x 3 GHz
2 GB RAM
RAM
2 GB
60 GB NVMe
NVMe
60 GB
200 Mbps Bandwidth
Bandwidth
200 Mbps
Public IP
$6
 /mo
2 x 3 GHz CPU
CPU
2 x 3 GHz
4 GB RAM
RAM
4 GB
80 GB NVMe
NVMe
80 GB
200 Mbps Bandwidth
Bandwidth
200 Mbps
Public IP
$8
 /mo
4 x 3 GHz CPU
CPU
4 x 3 GHz
8 GB RAM
RAM
8 GB
160 GB NVMe
NVMe
160 GB
200 Mbps Bandwidth
Bandwidth
200 Mbps
Public IP
$17
 /mo
8 x 3 GHz CPU
CPU
8 x 3 GHz
16 GB RAM
RAM
16 GB
320 GB NVMe
NVMe
320 GB
200 Mbps Bandwidth
Bandwidth
200 Mbps
Public IP
$37
 /mo
CPU
RAM
Gb
NVMe
Gb
Public IP
$0
 /mo

Deploy any software in seconds

Select the desired OS or App and install it in one click
OS Distributions
Pre-installed Apps
Custom Images
Ubuntu
Debian
CentOS

Hostman's commitment to simplicity
and budget-friendly solutions

1 CPU
2 CPU
4 CPU
8 CPU
Configuration
1 CPU, 1 GB RAM, 25 GB SSD
Hostman
DigitalOcean
Google Cloud
AWS
Vultr
Price
$4
$6
$6.88
$7.59
$5
Tech support
Free
$24/mo
$29/mo + 3% of
monthly charges
$29/mo or 3% of
monthly charges
Free
Backups
from $0.07/GB
20% or 30% higher
base daily/weekly fee
$0.03/GB per mo
$0.05/GB per mo
20% higher base
monthly/hourly fee
Bandwidth
Free
$0.01 per GB
$0.01 per GB
$0.09/GB first
10 TB / mo
$0.01 per GB
Live chat support
Avg. support response time
<15 min
<24 hours
<4 hours
<12 hours
<12 hours

What is a cloud server?

Cloud server is a virtualized computing resource hosted in the cloud, designed to deliver powerful performance without the need for physical hardware. It is built on a network of connected virtual machines, which enables flexible resource allocation, instant scalability, and high availability. Unlike traditional on-premises servers, a cloud-based server allows users to adjust resources dynamically, making it ideal for handling fluctuating workloads or unpredictable traffic spikes. Whether you're running an e-commerce store, a SaaS platform, or any application, a cloud web server provides the adaptability necessary to grow with your business.

Cloud servers solve a wide range of challenges, from reducing infrastructure costs to improving uptime and reliability. By leveraging the cloud, businesses can avoid the upfront investment and maintenance costs associated with physical servers. Additionally, a cloud server system allows users to deploy applications quickly, scale resources in real-time, and manage data more efficiently. The key benefits for clients include operational flexibility, cost savings, and the ability to respond quickly to changing demands.

Ready to buy a cloud server?

1 CPU / 1GB RAM / 25GB NVMe / 200 Mbps / $2/mo

Efficient tools for your convenient work

See all Products

Backups, Snapshots

Protect your data with regular backups and snapshots, ensuring you never lose crucial information

Firewall

Enhance your security measures with our robust firewall protection, safeguarding your infrastructure against potential threats

Load Balancer

Ensure optimal performance and scalability by evenly distributing traffic across multiple servers with our load balancer feature

Private Networks

Establish secure and isolated connections between your servers with private networks, shielding sensitive data and enhancing network efficiency

Trusted by 500+ companies and developers worldwide

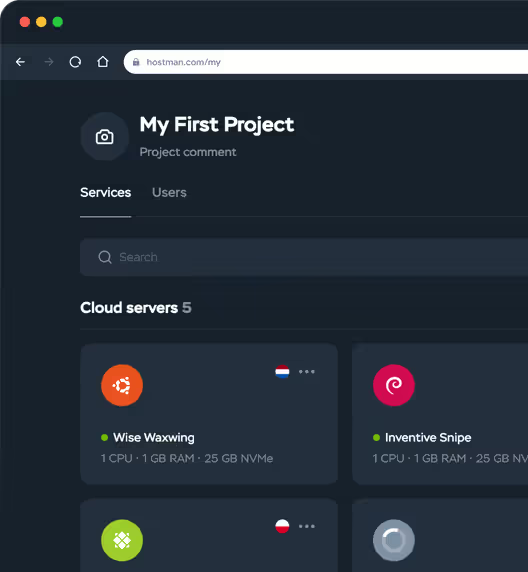
One panel to rule them all

Easily control your database, pricing plan, and additional services
through the intuitive Hostman management console
Project management
Organize your multiple cloud servers and databases into a single, organized project, eliminating confusion and simplifying management
Software marketplace
24 ready-made assemblies for any tasks: frameworks, e-commerce, analytics tools
Mobile responsive
Get the optimal user experience across all devices with our mobile-responsive design
Hostman Cloud

Code locally, launch worldwide

Our servers, certified with ISO/IEC 27001, are located in Tier 3 data
centers across the US, Europe, and Asia
🇺🇸 San Francisco
🇺🇸 San Jose
🇺🇸 Texas
🇺🇸 New York
🇳🇱 Amsterdam
🇳🇬 Lagos
🇩🇪 Frankfurt
🇵🇱 Gdansk
🇦🇪 Dubai
🇸🇬 Singapore
Anup k.
Associate Cloud Engineer
5.0 out of 5

"Hostman Comprehensive Review of Simplicity and Potential"

It been few years that I have been working on Cloud and most of the cloud service...
Mansur H.
Security Researcher
5.0 out of 5

"A perfect fit for everything cloud services!"

Hostman's seemless integration, user-friendly interface and its robust features (backups, etc) makes it much easier...
Adedeji E.
DevOps Engineer
5.0 out of 5

"Superb User Experience"

For me, Hostman is exceptional because of it's flexibility and user-friendliness. The platform's ability to offer dedicated computing resources acr...
Yudhistira H.
Mid-Market(51-1000 emp.)
5.0 out of 5

"Streamlined Cloud Excellence!"

What I like best about Hostman is their exceptional speed of deployment, scalability, and robust security features. Their...
Mohammad Waqas S.
Biotechnologist and programmer
5.0 out of 5

"Seamless and easy to use Hosting Solution for Web Applications"

From the moment I signed up, the process has been seamless and straightforward...
Mohana R.
Senior Software Engineer
5.0 out of 5

"Availing Different DB Engine Services Provided by Hostman is Convenient for my Organization usecases"

Hostman manages the cloud operations...
Faizan A.
5.0 out of 5

"Hostman is a great fit for me"

Hostman is a great fit for me. What do you like best about Hostman? It was very easy to deploy my application and create database, I didn't have
Adam M.
5.0 out of 5

"Perfect website"

This website is extremely user friendly and easy to use. I had no problems so didn't have to contact customer support. Really good website and would recommend to others.
Anup K.
4.0 out of 5

"Simplifying Cloud Deployment with Strengths and Areas for Growth"

What I like best about Hostman is its unwavering commitment to simplicity...
Naila J.
5.0 out of 5

"Streamlined Deployment with Room for Improvement"

Hostman impresses with its user-friendly interface and seamless deployment process, simplifying web application hosting...

More cloud services from Hostman

See all Products

Latest News

Servers

How to Use Nessus for Vulnerability Scanning on Ubuntu 22.04

Nessus is one of the most popular and widely used vulnerability scanners worldwide. Developed by Tenable, Inc., Nessus provides a comprehensive solution for identifying vulnerabilities, allowing organizations and individuals to detect and address potential security threats in their network infrastructure. With Nessus, you can conduct in-depth security analysis, covering a range of tasks from simple vulnerability detection to complex compliance checks. Versions of Nessus: Essentials, Professional, and Expert Nessus Essentials. A free version intended for home users and those new to the security field. This version provides basic scanning and vulnerability detection features. Nessus Professional. A paid version designed for security professionals and large organizations. It offers advanced features like large network scanning, integration with other security systems, and additional analysis and reporting tools. Nessus Expert. A premium version that includes all Professional features, along with additional tools and capabilities such as cloud scanning support, integration with security incident management systems, and further customization options. Nessus Vulnerability Scanning Features Vulnerability Detection. Nessus detects vulnerabilities across different systems and applications based on its extensive vulnerability database. Compliance Checks. Nessus performs checks to ensure compliance with various security standards and regulations. Integration with Other Systems. It can integrate with incident management systems, log management systems, and other security tools. Cloud Server Scanning. Nessus Expert offers scanning capabilities for cloud environments such as AWS, Azure, and Google Cloud. Data Visualization. Nessus includes dashboards and reports for visualizing scan results. Regular Updates. Nessus continuously updates its vulnerability database to keep up with emerging threats. Flexible Configuration. It provides customization options to tailor the scanning process to specific environments. Installing Nessus You can install Nessus on Ubuntu in two ways: as a Docker container or as a .deb package. Here’s a step-by-step guide for both methods. Installing Nessus on Ubuntu via Docker Preparation First, ensure that Docker is installed on your system. If Docker isn’t installed, follow this guide to install Docker on Ubuntu 22.04. Download the Nessus Image Download the latest Nessus image from Docker Hub by running: docker pull tenable/nessus:latest-ubuntu The download process may take around 10 minutes. Create and Start the Container Once the image is downloaded, create and start the container with: docker run --name "nessus_hostman" -d -p 8834:8834 tenable/nessus:latest-ubuntu Here: --name "nessus_hostman" sets the container's name. -d runs the container in detached mode (background). -p 8834:8834 maps port 8834 of the container to port 8834 on the host, making Nessus accessible at localhost:8834. If you need to restart the container after stopping it, use: docker start nessus_hostman Installing Nessus on Ubuntu as a .deb Package Download the Installation Package Start by downloading the installer for Ubuntu with: curl --request GET \  --url 'https://www.tenable.com/downloads/api/v2/pages/nessus/files/Nessus-10.6.1-ubuntu1404_amd64.deb' \  --output 'Nessus-10.6.1-ubuntu1404_amd64.deb' Install Nessus With the installation file downloaded to your current directory, use dpkg to install Nessus: sudo dpkg -i ./Nessus-10.6.1-ubuntu1404_amd64.deb Start the Nessus Service After installing, start the nessusd service: sudo systemctl start nessusd.service Verify the Nessus Service Check if nessusd is active and running without errors: sudo systemctl status nessusd You should see the status: Active: active (running). Accessing Nessus in a Browser Now, access Nessus by opening a browser and navigating to: https://localhost:8834/ Port 8834 is the default port for Nessus. Most browsers will show a security warning when accessing Nessus, but it’s safe to proceed by clicking Advanced and continuing to the site. Initial Setup of Nessus Navigate to the Setup Page. After starting the container, open your browser and go to https://localhost:8834. You’ll see a loading screen as necessary components are downloaded. Register on the Tenable Website. While Nessus is downloading components, register on the Tenable website to obtain an activation code. The code will be sent to the email address you provide. Use the Setup Wizard Once components are downloaded, the setup wizard will launch. Click Continue. Select Nessus Essentials. Enter the activation code sent to your email. Create a user account by entering a username and password. Completing the Installation. Wait for the setup to finish and for all plugins to load. Once everything is complete, you’ll see the status updates on https://localhost:8834/#/settings/about/events. After this, the Nessus installation is fully set up and ready to use. Setting Up the beeBox Server In this guide, we’ll use the beeBox virtual machine to demonstrate Nessus’s capabilities. If you’re scanning your own server, skip this step. After successfully installing and configuring Nessus, it’s time to test it in action. To do this, we need a target system to scan for vulnerabilities. We’ll use a virtual machine called beeBox, which is based on bWAPP (a "buggy" web application). Designed with known vulnerabilities, beeBox is perfect for security professionals, developers, and students to practice identifying and mitigating security threats. beeBox includes the following vulnerabilities: Injection (HTML, SQL, LDAP, SMTP, etc.) Broken Authentication & Session Management Cross-Site Scripting (XSS) Insecure Direct Object References Security Misconfiguration Sensitive Data Exposure Missing Function Level Access Control Cross-Site Request Forgery (CSRF) Using Components with Known Vulnerabilities Unvalidated Redirects & Forwards XML External Entity (XXE) Attack sServer-Side Request Forgery (SSRF) These make beeBox ideal for showcasing Nessus’s scanning capabilities. Installing beeBox on VirtualBox We’ll go through the installation process using VirtualBox 7.0. Steps may vary slightly for other VirtualBox versions. Download the beeBox Image. Download the beeBox virtual machine image (the bee-box_v1.6.7z file) and extract it. Create a New Virtual Machine. Open VirtualBox, click New, and in the Name and Operating System section: Enter a name for the virtual machine. Set the OS type to Linux. Choose Oracle Linux (64-bit) as the version. Configure Hardware. Allocate 1024 MB of RAM and 1 CPU to the virtual machine. Select a Hard Disk. In the Hard Disk section: Choose Use an Existing Virtual Hard Disk File. Click Add and select the path to the bee-box.vmdk file you extracted earlier. Configure Network Settings. Before starting the VM: Go to Settings > Network. Change Attached to from NAT to Bridged Adapter to ensure the VM is on the same network as your primary machine. Start the Virtual Machine. Click Start to launch beeBox. Set Keyboard Layout. Once the desktop loads: Click on USA in the top menu. Select Keyboard Preferences, go to the Layouts tab, and set Keyboard model to IBM Rapid Access II. Retrieve IP Address. Open a terminal in beeBox and run ip a to find the virtual machine’s IP address. You can then access the beeBox application from your main machine using this IP, confirming its accessibility. Scanning with Nessus Nessus General Settings Before using Nessus to scan for vulnerabilities, it's essential to understand its interface and configuration options. The main screen is divided into two primary tabs: Scans and Settings. First, let’s take a closer look at the Settings tab. About: Overview: Provides general information about your Nessus installation, including the version, license details, and other key information. License Utilization: Displays all IP addresses that have been scanned. In the free version, up to 16 hosts can be scanned. Hosts not scanned in the last 90 days will be automatically released from the license. Software Update: Allows you to set up automatic updates or initiate updates manually. Encryption Password: Lets you set a password for encrypting Nessus data. This password is crucial for data recovery if set, as data will be inaccessible without it. Events: Enables you to view the update history and other important events. Advanced Settings: Contains additional configurations for Nessus. Though we won’t cover each option in detail here, you can find specifics about each setting on the official website. Proxy Server: If your network requires a proxy server for internet access or to reach target servers, you can configure the proxy settings here. SMTP Server: This allows you to configure an SMTP server so that Nessus can send scan result notifications and other alerts via email. Running a Basic Scan Now let’s move to the Scans tab. It’s essential to accurately set up the scan parameters for optimal efficiency and accuracy in detecting vulnerabilities. Initiate a New Scan. On the main screen, click New Scan to open the scan creation wizard. Select Scan Type. For this example, we’ll choose Basic Network Scan. General Settings: General: Enter a name and description for the scan, choose a folder for the results, and specify the target IP address (e.g., the IP of the beeBox virtual machine). Schedule: Set up scan frequency if desired (optional). Notifications: Add email addresses to receive notifications about scan results. For this to work, configure the SMTP server in the settings. Detailed Settings: Discovery: Here, you can select the type of port scan—common ports (4,700 commonly used ports), all ports, or Custom for detailed port scan settings. For this example, we’ll select common ports. Assessment: Choose the vulnerability detection method. We’ll use Scan for all web vulnerabilities to speed up the scan. Custom options are also available, and details for each setting are provided in the documentation. Report: Set report generation parameters if needed (we’ll leave this unchanged for the example). Advanced: Configure scan speed settings. You can enable or disable debugging for plugins in manual settings mode. For this example, we’ll set Default. You can find more information in the docs. Additional Settings Above the primary settings, you’ll see two tabs: Credentials and Plugins. Credentials: Allows you to provide credentials for accessing services on the target host (useful for finding vulnerabilities that require non-privileged access). Plugins: Displays the list of plugins that will be used during the scan. When using other types of scans, such as advanced scans, you can enable or disable specific plugins. Click Save to save your scan setup, then return to the main screen. Click Launch to start the scan. The scan is now underway, and you can monitor its progress by clicking on the scan in the Scans tab. Viewing Scan Results in Nessus After completing a scan, you can analyze the results by navigating to the specific scan. The main section of the results page contains a table with detailed information on detected vulnerabilities: Severity: Reflects the threat level based on the CVSS (Common Vulnerability Scoring System) metric. CVSS: Shows the CVSSv2 metric score, indicating the risk level of the vulnerability. VPR: An alternative risk metric by Tenable, providing an additional risk assessment. Name: The name of the detected vulnerability. Family: The category or group the vulnerability belongs to. Count: The number of instances of this vulnerability. It’s worth noting that some vulnerabilities may be grouped as Mixed.To change this grouping, go to Settings > Advanced and set Use Mixed Vulnerability Groups to No. On the left side of the table, you’ll find information about the target host, along with a chart displaying vulnerabilities' distribution by severity level. To explore a specific vulnerability in detail, click on its name. For example, let’s look at the Drupal Database Abstraction API SQLi vulnerability. Vulnerability Description: A brief description of the issue and the software version in which it was patched. Detection Details: Reports on vulnerability detection and recommended mitigation methods. Technical Details: An SQL query that was used to identify the vulnerability. In the left panel, you can find: Plugin Information: Description of the plugin that detected the vulnerability. VPR and CVSS Ratings: Displays the severity ratings of the vulnerability according to different metrics. Exploitation Data: Information about the potential for exploiting the vulnerability. References: Useful links to resources like exploit-db, nist.gov, and others, where you can learn more about the vulnerability. Conclusion This guide covered Nessus's installation, configuration, and use for vulnerability scanning. Nessus is a powerful automated tool, but its effectiveness relies on accurate configuration. Remember that network and system security require a comprehensive approach; automated tools are best used alongside ongoing security education and layered defense strategies for reliable protection.
20 November 2024 · 11 min to read
PHP

Installing and Switching PHP Versions on Ubuntu: A Step-by-Step Guide

PHP is a scripting programming language commonly used for developing web applications. It allows developers to create dynamic websites that adapt their pages for specific users. These websites are not stored on the server in a ready-made form but are created on the server after a user request. This means that PHP is a server-side language, meaning scripts written in PHP run on the server, not the user's computer. There are many different versions of PHP. The language becomes more powerful and flexible with each new version, offering developers more opportunities to create modern web applications. However, not all websites upgrade or are ready to upgrade to the latest PHP version and remain on older versions. Therefore, switching between versions is an essential task for many web developers. Some developers want to take advantage of new features introduced in newer versions, while others need to fix bugs and improve the security of existing applications. In this article, we will go over how to install PHP on Ubuntu and how to manage different PHP versions. How to Install PHP on the Server To install PHP on Ubuntu Server, follow these steps: Connect to the server via SSH. Update the package list: sudo apt update Install the required dependencies: sudo apt install build-essential libssl-dev Download the installation script from the official website, replacing <version> with the desired version: curl -L -O https://www.php.net/distributions/php-<version>.tar.gz Extract the downloaded file, replacing <version> with the downloaded version: tar xzf php-<version>.tar.gz Navigate to the directory with the installed PHP: cd php-<version> Configure the installation script: ./configure Build PHP: make Install PHP: sudo make install After completing these steps, PHP will be installed on your server. The next step is to install a web server to work with PHP. The configuration may involve specifying the PHP module in the web server configuration file and setting up how .php files are handled. Finally, restart the web server. For example, to restart Apache, you can run the following command: sudo service apache2 restart How to Check PHP Version There are several ways to find out which version of PHP a website is running: Use the terminal. Create a script with phpinfo() in the website's root directory. Check PHP Version via Terminal Run the command in the terminal: php -v You will get output similar to: PHP 8.3.13 (cli) (built: Oct 30 2024 11:27:41) (NTS)Copyright (c) The PHP GroupZend Engine v4.3.13, Copyright (c) Zend Technologies    with Zend OPcache v8.3.13, Copyright (c), by Zend Technologies Check PHP Version with phpinfo() Create a file named phpinfo.php with the following content: <?phpphpinfo( );?> Save the file in the root directory of your website (where the index.html or index.php file is located). Open this file in your browser by using the following URL: http://your_website_address/phpinfo.php You will see a page with detailed information about the PHP configuration. After finding out the PHP version, be sure to delete the phpinfo.php file as it contains important server configuration information that attackers could exploit. How to Manage PHP Versions To switch between installed PHP versions on Ubuntu, follow these steps. Check if multiple PHP versions are installed. To see the list of installed PHP packages, run the command: dpkg --list | grep php Install the php-switch package, which allows change PHP versions easily: sudo apt-get install -y php-switch Switch to the desired PHP version using the php-switch command. For example, to switch to PHP 7.4, run: php-switch 8.2 Verify which PHP version is currently active by running: php -v Some scripts and extensions may only work with certain PHP versions. Before switching, make sure that all the scripts and extensions you are using support the new version. Otherwise, the website may become inaccessible or malfunction. Troubleshooting If PHP scripts are not being processed on your server, the first thing to check is the web server's functionality. Open a browser and go to the website where PHP scripts are not working. If the page opens but the PHP script output is not displayed, the problem may lie with PHP. Here are some steps you can take to troubleshoot the issue. Check PHP Service Status Run the following command, using your PHP version (e.g., PHP 8.3): sudo service php8.3-fpm status If the service is running, the output should indicate active (running). If the service is not running, start it with this command: sudo service php8.3-fpm start Check PHP Log Files To view PHP log files, use the following command: tail /var/log/php7\8.3-fpm.log This command will display the last few lines of the PHP log file, which may help identify the issue. Check PHP Configuration Open the php.ini file in a text editor and ensure the display_errors option is set to On. This will allow PHP errors to be displayed on your website pages. Check for Script Errors Open the PHP scripts in a text editor and look for syntax errors or other issues that could prevent the scripts from working properly. Check for Web Server Restrictions Check the web server configuration for any restrictions that might affect the execution of PHP scripts. For example, there may be restrictions in the .htaccess file that prevent certain directories from running scripts. Test the Script on Another Server If the script works on another server, the issue may be related to the configuration of the current server.
20 November 2024 · 5 min to read
Servers

Setting Up NTP on a Server: A Step-by-Step Guide

NTP (Network Time Protocol) is used to synchronize system time with a reference time provided by special servers. This article will cover how to configure NTP on various operating systems and devices, starting with a comprehensive guide on setting up an NTP Server on Linux. Configuring an NTP Server on Linux We'll demonstrate synchronization setup using Ubuntu, but this guide also applies to Debian and most Linux-based systems. We’ve divided the instructions into three parts: the first covers installing the NTP server, the second explains synchronizing NTP clients, and the third covers advanced synchronization settings. To follow this guide, you will need: A cloud server with Ubuntu installed A root user or a user with sudo privileges nano or any other editor installed Installing the NTP Server These steps will guide you through installing and preparing the NTP server for further configuration. Update the repository index to ensure you can download the latest software versions. Use the following command: sudo apt-get update Install the NTP server: sudo apt-get install ntp Confirm the installation by choosing Y if prompted (Y/N). Wait until the software is downloaded and installed. Verify the installation: sntp --version The output should display the version number and the installation time. Switch to the nearest server pool. The server should receive accurate time by default, but it’s better to connect to a server pool closest to your location for extra reliability. To do this, edit the ntp.conf file located at /etc/ntp.conf. Open it with nano (you need sudo privileges) by entering: sudo nano /etc/ntp.conf You’ll see four lines, which we’ve highlighted in orange for reference: These are the default pools, which we’ll replace with local ones (for example, for the USA, we can use NTP servers from this page). After replacing the lines, save and close ntp.conf by pressing Ctrl+O and Ctrl+X. Restart the server: sudo service ntp restart Check the server status: sudo service ntp status The output should indicate Active (running) on one of the first lines (Active) and the server start time. Configure the firewall. To allow client access to the server, open UDP port 123 using UFW with the following command: sudo ufw allow from any to any port 123 proto udp The installation is complete, and the server is running; now, you can proceed with further configuration. Configuring NTP Client Synchronization The following steps will allow client systems to synchronize with our NTP server, which will serve as their primary time source. Check the Connection To verify the network configuration for NTP, enter the following command in the terminal: sudo apt-get install ntpdate Specify IP Address and Hostname To configure the server’s IP and hostname, edit the hosts file located at /etc/hosts: sudo nano /etc/hosts Add the relevant data in the third line from the top (the address below is just an example; replace it with the actual IP of your NTP server): 192.168.154.142 ntp-server Press Ctrl+X to exit and save changes by pressing Y. Alternatively, if you have a DNS server, you can perform this step there. Verify Client Synchronization with the Server To check if synchronization is active between the server and client, enter: sudo ntpdate ntp-server The output will show the time offset. A few milliseconds difference is normal, so you can ignore small values. Disable the timesyncd Service This service synchronizes the local system time, but we don't need it since our clients will sync with the NTP server. Disable it with: sudo timedatectl set-ntp off Install NTP on the Client System Install NTP on the client with this command: sudo apt-get install ntp Set Your NTP Server as the Primary Reference To ensure clients sync specifically with your server, open the ntp.conf file and add the following line: server NTP-server-host prefer iburst The prefer directive marks the server as preferred, and iburst allows multiple requests to the server for higher synchronization accuracy. Save the changes by pressing Ctrl+X and confirming with Y. Restart the Server Restart the NTP server with this straightforward command: sudo service ntp restart Check the Synchronization Queue Finally, check the synchronization status by entering: ntpq -ps This command displays the list of servers in the synchronization queue, including your NTP server as the designated source. Advanced Synchronization Options Now that we’ve set up the NTP server and synchronized client machines, we’ll revisit the ntp.conf file (located at /etc/ntp.conf), which contains additional configurations to ensure robust synchronization with external sources. Preferred Server Mark the most reliable server or server pool with the prefer directive we’ve used before. For example: server 1.north-america.pool.ntp.org prefer The server directive indicates a specific server, while pool can be used to specify a pool of servers. Don’t forget the line server 127.127.1.0 at the end of the pool list, which defaults to the system time if the connection is lost. Security Settings Make sure the following lines are included in ntp.conf: restrict default kod notrap nomodify nopeer noquery The default command applies these settings as defaults for all restrict commands: kod (Kiss-o’-Death) limits the rate of requests. notrap blocks the acceptance of control commands. nomodify restricts commands that might alter the server state. nopeer prohibits synchronization with external hosts. noquery blocks query requests. For IPv4, use -4 before default, and for IPv6, use -6. Here’s an example of using some of these commands. The following line allows synchronization of nodes in a specific network while restricting nodes from receiving control or state-altering commands: restrict 192.168.0.0 mask 255.255.255.0 nomodify notrap The following lines are required for the server to communicate with itself: restrict 127.0.0.1restrict ::1 Finally, remember to restart the server after making these changes. Verifying NTP Operation To check if NTP is functioning correctly, use the command ntpq -p. Example output: In the first column, you’ll see the synchronization server’s address, followed by its parent server, stratum level (st column), and nup (t column). The next three columns show details on the last synchronization time, sync interval, and reliability status . The final two columns display the time difference between the synchronized server and the reference server, as well as the offset. Pay attention to the symbols in the first column, which appear before the IP address: A + symbol indicates a reliable server for synchronization and a - means the opposite. An * indicates the current server chosen for synchronization. Occasionally, an x will appear, which means the server is unavailable. Checking if the Server Provides Accurate Time To ensure the server is distributing the correct time, run the ntpdate command from another system, specifying the IP address of the NTP server you want to verify. The output should look something like this: adjust time server (IP address here) offset 0.012319 sec The number represents the time offset. Here, an offset of about 0.01 seconds (12 milliseconds) is perfectly acceptable. Now that we’ve completed the Linux setup, let’s look at configuring the NTP protocol on Windows. Configuring an NTP Server on Windows Server To install and configure an NTP server on Windows Server, you'll need to make some changes in the registry and run commands in the command prompt.  Before proceeding with the configuration, you must start the service. This is done by modifying the following registry entry: HKLM\System\CurrentControlSet\services\W32Time\TimeProviders\NtpServer In this section, find the Enabled entry on the right and set it to 1 so that the Data column displays: 0x00000001 (1) Next, open cmd and enter the command needed to restart the protocol: net stop w32time && net start w32time Make sure to run this command from C:\Users\Administrator. To verify that NTP is enabled, use the following command: w32tm /query /configuration You’ll get a long entry, and you should check the block NtpServer <Local>. In the Enabled line, the value should be 1. Now, open UDP port 123 in the firewall for proper client servicing, and then proceed with the configuration. Return to the registry and look for the entry: HKLM\System\CurrentControlSet\services\W32Time\Parameters This section contains many parameters, but the main one is Type, which can take one of four values: NoSync — No synchronization. NTP — Synchronization with external servers specified in the NtpServer registry entry (this is the default for standalone machines). NT5DS — Synchronization according to the domain hierarchy (default for machines in a domain). AllSync — Synchronization with all available servers. Now, go back to the registry and configure the values under the NtpServer section. Most likely, only the Microsoft server is listed. You can add others, paying attention to the flag at the end: 0x1, SpecialInterval — Standard mode recommended by Microsoft. 0x2, UseAsFallbackOnly — Use this server as a fallback. 0x4, SymmetricActive — This is the main mode for NTP servers. 0x8, Client — Used when synchronization issues occur. The last thing you need to do is set the synchronization interval in the section: W32Time\TimeProviders\NtpClient The parameter is SpecialPollInterval, where you should set the desired value (in seconds). By default, it’s set to one week. If you want more frequent synchronization, set: 86400 for 1 day. 21600 for a quarter of a day (6 hours). 3600 for 1 hour. The last value is optimal in terms of system load and acceptable precision when frequent synchronization is required. Configuring an NTP Server on Cisco Devices On Cisco devices, the process is simple and quick: Enter configuration mode with the command: conf t Set the time zone using the command: clock timezone <timezone> <offset> For example: clock timezone CST -6 Next, enter the command to set the NTP source: ntp source Specify the source. If you want to make the server the primary one for other machines in the network, use the following command: ntp master 2 The number should be 2 or greater. Use the command ntp update-calendar to update the time. Enter the names or IP addresses of the NTP servers. Enter the time zone with the command: clock timezone And set the source using: ntp source To check the configuration or troubleshoot, use the show command. It will be useful for checking the time (show clock), NTP status (show ntp status), and associations (show ntp associations). Configuring an NTP Server on MikroTik Routers We will configure the NTP server using SNTP: In Winbox, go to System – SNTP Client. Find the SNTP Client section and enable it by checking the Enabled box. In the Server DNS Names field below, enter the IP addresses of the NTP servers. To check if everything is working, go to System – Clock. Set the time zone by choosing it from the dropdown list or check the Time Zone Autodetect box, and the time zone will be set automatically. The synchronization interval can be seen in the Poll Interval field in the SNTP Client menu. Below, you will find the last synchronization time in the Last Update field. That’s it! Now you’ve learned how to configure NTP on different operating systems and devices.
19 November 2024 · 9 min to read
MySQL

How to Find and Delete Duplicate Rows in MySQL with GROUP BY and HAVING Clauses

Duplicate entries may inadvertently accumulate in databases, which are crucial for storing vast amounts of structured data. These duplicates could show up for a number of reasons, including system errors, data migration mistakes, or repeated user submissions. A database with duplicate entries may experience irregularities, sluggish performance, and erroneous reporting. Using the GROUP BY and HAVING clauses, as well as a different strategy that makes use of temporary tables, we will discuss two efficient methods for locating and removing duplicate rows in MySQL. With these techniques, you can be sure that your data will always be accurate, clean, and well-organized. Database duplication in MySQL tables can clog your data, resulting in inaccurate analytics and needless storage. Locating and eliminating them is a crucial database upkeep task. This is a detailed guide on how to identify and remove duplicate rows. If two or more columns in a row have identical values, it is called a duplicate row. For instance, rows that have the same values in both the userName and userEmail columns of a userDetails table may be considered duplicates. Benefits of Removing Duplicate Data The advantage of eliminating duplicate data is that duplicate entries can slow down query performance, take up extra storage space, and produce misleading results in reports and analytics. The accuracy and speed of data processing are improved by keeping databases clean, which is particularly crucial for databases that are used for critical applications or are expanding. Requirements Prior to starting, make sure you have access to a MySQL database or have MySQL installed on your computer. The fundamentals of general database concepts and SQL queries. One can execute SQL commands by having access to a MySQL client or command-line interface. To gain practical experience, you can create a sample database and table that contains duplicate records so that you can test and comprehend the techniques for eliminating them. Creating a Test Database Launch the MySQL command-line tool to create a Test Database. mysql -u your_username -p Create a new database called test_dev_db after entering your MySQL credentials. CREATE DATABASE test_dev_db; Then, switch to this newly created database:. USE test_dev_db; Add several rows, including duplicates, to the userDetails table after creating it with the CREATE TABLE query and INSERT query below. CREATE TABLE userDetails ( userId INT AUTO_INCREMENT PRIMARY KEY, userName VARCHAR(100), userEmail VARCHAR(100) ); INSERT INTO userDetails (userName, userEmail) VALUES (‘Alisha’, ‘[email protected]’), (‘Bobita, ‘[email protected]’), (‘Alisha’, ‘[email protected]’), (‘Alisha’, ‘[email protected]’); Using GROUP BY and HAVING to Locate Duplicates Grouping rows according to duplicate-defining columns and using HAVING to filter groups with more than one record is the simplest method for finding duplicates. Now that you have duplicate data, you can use SQL to determine which rows contain duplicate entries. MySQL's GROUP BY and HAVING clauses make this process easier by enabling you to count instances of each distinct value. An example of a table structure is the userDetails table, which contains the columns userId, userName, and userEmail. The GROUP BY clause is useful for counting occurrences and identifying duplicates because it groups records according to specified column values. The HAVING clause  allows duplicate entries in groups formed by GROUP BY to be found by combining groups based on specific criteria. Table userDetails Structure userId userName userEmail 1 Alisha  [email protected] 2 Bobita  [email protected] 3 Alisha  [email protected] 4 Alisha  [email protected] In the above table userDetails, records with identical userName and userEmail values are considered duplicates. Finding Duplicates Query for find the duplicate entries: SELECT userName, userEmail, COUNT(*) as count FROM userDetails GROUP BY userName, userEmail HAVING count > 1; Rows are grouped by userName and userEmail in the aforementioned query, which also counts entries within the group and eliminates groups with a single entry (no duplicates). Explanation: SELECT userName, userEmail, COUNT(*) as count: Retrieves the count of each combination of username and userEmail, as well as their unique values. GROUP BY userName, userEmail: Records are grouped by username and user email using the GROUP BY userName, userEmail function COUNT (*): Tallies the rows in each set. HAVING occurrences > 1: Recurring entries are identified by displaying only groups with more than one record. This query will return groups of duplicate records based on the selected columns. userName userEmail count Alisha [email protected] 3 Eliminating Duplicate Rows After finding duplicates, you may need to eliminate some records while keeping the unique ones. Joining the table to itself and removing rows with higher userId values is one effective method that preserves the lowest userId for every duplicate. Use the SQL query to remove duplicate rows while keeping the lowest userId entry. DELETE u1 FROM userDetails u1 JOIN userDetails u2 ON u1. userName = u2. userName AND u1. userEmail = u2. userEmail AND u1. userId > u2. userId ; Explanation: u1 & u2: Aliases for the userDetails table to ease a self-join. ON u1. userName = u2. userName AND u1. userEmail = u2. userEmail: Matches rows with identical userName, userEmail. AND u1. userId > u2. userId: Removes rows with higher userId values, keeping only the row with the smallest userId. Because this action cannot be undone, it is advised that you backup your data before beginning the deletion procedure. Confirming Duplicate Removal To confirm that all duplicates have been removed, repeat the Step 1 identification query. SELECT userName, userEmail, COUNT(*) as count FROM userDetails GROUP BY userName, userEmail HAVING count > 1; All duplicates have been successfully eliminated if this query yields no rows. Benefits of Employing GROUP BY and HAVING The GROUP BY and HAVING clauses serve as vital instruments for the aggregation of data and the filtration of grouped outcomes. These functionalities are especially useful for detecting and handling duplicate entries or for condensing extensive datasets. Below are the primary benefits of employing these clauses. Efficient Identification of Duplicates Data Aggregation and Summarization Filtering Aggregated Results with Precision Versatility Across Multiple Scenarios Compatibility and Simplicity Enhanced Query Readability Support for Complex Aggregations The GROUP BY and HAVING clauses serve as essential instruments for data aggregation, identifying duplicates, and filtering results. Their effectiveness, ease of use, and adaptability render them crucial for database management and data analysis activities, allowing users to derive insights and handle data proficiently across a variety of applications. Identifying Duplicates Using a Temporary Table When dealing with large datasets, it can be easier and more efficient to separate duplicates using a temporary table before deleting them. Creating the Table Make a temporary table to store duplicate groups according to predetermined standards (e.g. A. username, along with userEmail. CREATE TEMPORARY TABLE temp_view_duplicates AS SELECT username, userEmail, MIN (userId) AS minuid FROM userDetails GROUP BY username, userEmail, HAVING COUNT(*) > 1; Explanation: CREATE TEMPORARY TABLE temp_view_duplicates AS: Creates a temporary table named temp_view_duplicates. SELECT userName, userEmail, MIN(userId) AS minuid: Groups duplicates by userName and userEmail, keeping only the row with the smallest userId. GROUP BY userName, userEmail: Groups rows by userName, userEmail. HAVING COUNT(*) > 1: Filters only groups with more than one row, identifying duplicates. This temporary table will now contain one representative row per duplicate group (the row with the smallest id). Deleting Duplicates from the Main Table Now that we have a list of unique rows with duplicates in the temp_view_duplicates table, we can use the temporary table to remove duplicates while keeping only the rows with the smallest userId. Use the following DELETE command: DELETE FROM userDetails WHERE (username, userEmail) IN ( SELECT username, userEmail FROM temp_view_duplicates ) AND userId NOT IN ( SELECT minuid FROM temp_view_duplicates ); Explanation: WHERE (username, userEmail,) IN: Targets only duplicate groups identified in temp_view_duplicates. AND userId NOT IN (SELECT minuid FROM temp_view_duplicates): Ensures that only duplicate rows (those with higher userId values) are deleted. Verifying Results To confirm that duplicates have been removed, query the userDetails table: SELECT * FROM userDetails; Only unique rows should remain. Temporary tables (CREATE TEMPORARY TABLE) are automatically dropped when the session ends, so they don’t persist beyond the current session. When making extensive deletions, think about utilizing a transaction to safely commit or undo changes as necessary. Key Advantages of Using a Temporary Table Lower Complexity: By isolating duplicates, the removal process is simpler and clearer. Enhanced Efficiency: It's faster for large datasets, as it avoids repeated joins. Improved Readability: Using a temporary table makes the process more modular and easier to understand. Conclusion Eliminating duplicate records is essential for maintaining a well-organized database, improving performance, and ensuring accurate reporting. This guide presented two approaches: Direct Method with GROUP BY and HAVING Clauses: Ideal for small datasets, using self-joins to delete duplicates. Temporary Table Approach: More efficient for larger datasets, leveraging temporary storage to streamline deletion. Choose the method that best fits your data size and complexity to keep your database clean and efficient.
19 November 2024 · 8 min to read
Servers

iSCSI Protocol: How It Works and What It’s Used For

iSCSI, or Internet Small Computer System Interface, is a protocol for data storage that enables SCSI commands to be run over a network connection, typically Ethernet. In this article, we’ll look at how it works, its features and advantages, and explain how to configure the iSCSI protocol. How iSCSI Works To understand how iSCSI functions, let’s look at its structure in more detail. The main components are initiators and targets. This terminology is straightforward: initiators are hosts that initiate an iSCSI connection, while targets are hosts that accept these connections. Thus, storage devices serve as targets to which the initiator hosts connect. The connection is established over TCP/IP, with iSCSI handling the SCSI commands and data organization, assembling them into packets. These packets are then transferred over a point-to-point connection between the local and remote hosts. iSCSI processes the packets it receives, separating out the SCSI commands, making the OS perceive the storage as a local device, which can be formatted and managed as usual. Authentication and Data Transmission In iSCSI, initiators and targets are identified using special names: IQN (iSCSI Qualified Name) and EUI (Extended Unique Identifier), the latter used with IPv6 protocol. Example of IQN: iqn.2003-02.com.site.iscsi:name23. Here, 2003-02 represents the year and month the domain site.com was registered. Domain names in IQN appear in reverse order. Lastly, name23 is the unique name assigned to the iSCSI host. Example of EUI: eui.fe9947fff075cee0. This is a hexadecimal value in IEEE format. The upper 24 bits identify a specific network or company (such as a provider), while the remaining 40 bits uniquely identify the host within that network. Each session involves two phases. The first phase is authentication over TCP. After successful authentication, the second phase is data exchange between the initiator host and the storage device, conducted over a single connection, eliminating the need to track requests in parallel. When the data transfer is complete, the connection is closed using an iSCSI logout command. Error Handling and Security To address data loss, iSCSI includes mechanisms for data recovery, such as PDU packet retransmission, connection recovery, and session restart, while canceling any unprocessed commands. Data exchange security is ensured through the CHAP protocol, which doesn’t directly transmit confidential information (like passwords) but uses a hash comparison. Additionally, all packets are encrypted and integrity-checked using IPsec protocols integrated into iSCSI. Types of iSCSI Implementations There are three main types of iSCSI implementations: Host CPU Processing: Processing is handled by the initiator host's CPU. TCP/IP Offload with Shared Load: Most packets are processed by the storage device, while the initiator host handles certain exceptions. Full TCP/IP Offload: All data packets are processed entirely by the storage device. Additionally, iSCSI can be extended for RDMA (Remote Direct Memory Access) to allow direct remote memory access. The advantage of RDMA is that it transfers data without consuming system resources on network nodes, achieving high data exchange speeds. In the case of iSCSI, SCSI buffer memory is used to connect to storage, eliminating the need for intermediate data copies and reducing CPU load. This iSCSI variation is known as iSER (iSCSI Extension for RDMA). Advantages of iSCSI iSCSI provides not only cost-effectiveness and improved performance but also offers: Simplified Network Storage: Since iSCSI operates over Gigabit Ethernet devices, network storage becomes easier to set up and manage. Ease of Support: iSCSI uses the same principles as TCP/IP, so IT specialists don’t need additional training. Network Equipment Compatibility: iSCSI is based on the TCP/IP network model, so almost any storage-related network equipment is compatible within an iSCSI environment. Differences Between iSCSI SAN and FC SAN In discussions comparing these two protocols, iSCSI SAN (Storage Area Network) and FC SAN (Fibre Channel SAN) are often seen as competitors. Let’s look at the key differences iSCSI SAN is a more cost-effective solution than FC SAN. iSCSI offers high data transfer performance and doesn’t require additional specialized hardware—it operates on existing network equipment. However, for maximum performance, network adapters are recommended. By contrast, FC SAN requires additional hardware like switches and host bus adapters. To illustrate, here is a table summarizing key differences between the protocols: Feature iSCSI SAN Fibre Channel SAN Operation on existing network Possible Not possible Data transfer speed 1 to 100 Gbps 2 to 32 Gbps Setup on existing equipment Yes No Data flow control No packet retransmission protection Reliable Network isolation No Yes Conclusion As shown in the comparison table, each protocol has its strengths, so the choice depends on the requirements of your storage system. In short, iSCSI is ideal when cost efficiency, ease of setup, and straightforward protocol management are priorities. On the other hand, FC offers low latency, easier scalability, and is better suited for more complex storage networks.
18 November 2024 · 5 min to read
Nginx

How to Set Up Load Balancing with Nginx

Modern applications can handle many requests simultaneously, and even under heavy load, they must return correct information to users. There are different ways to scale applications: Vertical Scaling: add more RAM or CPU power by renting or purchasing a more powerful server. It is easy during the early stages of the application’s development, but it has drawbacks, such as cost and the limitations of modern hardware. Horizontal Scaling: add more instances of the application. Set up a second server, deploy the same application on it, and somehow distribute traffic between these instances. Horizontal scaling, on the one hand, can be cheaper and less restrictive in terms of hardware. You can simply add more instances of the application. However, now we need to distribute user requests between the different instances of the application. Load Balancing is the process of distributing application requests (network traffic) across multiple devices. A Load Balancer is a middleware program between the user and a group of applications. The general logic is as follows: The user accesses the website through a specific domain, which hides the IP address of the load balancer. Based on its configuration, the load balancer determines which application instance should handle the user's traffic. The user receives a response from the appropriate application instance. Load Balancing Advantages Improved Application Availability: Load balancers have the functionality to detect server failures. If one of the servers goes down, the load balancer can automatically redirect traffic to another server, ensuring uninterrupted service for users. Scalability: One of the main tasks of a load balancer is to distribute traffic across multiple instances of the application. This enables horizontal scaling by adding more application instances, increasing the overall system performance. Enhanced Security: Load balancers can include security features such as traffic monitoring, request filtering, and routing through firewalls and other mechanisms, which help improve the application's security. Using Nginx for Network Traffic Load Balancing There are quite a few applications that can act as a load balancer, but one of the most popular is Nginx.  Nginx is a versatile web server known for its high performance, low resource consumption, and wide range of capabilities. Nginx can be used as: A web server A reverse proxy and load balancer A mail proxy server And much more. You can learn more about Nginx's capabilities on its website. Now, let's move on to the practical setup. Installing Nginx on Ubuntu Nginx can be installed on all popular Linux distributions, including Ubuntu, CentOS, and others. In this article, we will be using Ubuntu. To install Nginx, use the following commands: sudo apt updatesudo apt install nginx To verify that the installation was successful, you can use the command: systemctl status nginx The output should show active (running). The configuration files for Nginx are located in the /etc/nginx/sites-available/ directory, including the default file that we will use for writing our configuration. Example Nginx Configuration First, we need to install nano: sudo apt install nano Now, open the default configuration file: cd /etc/nginx/sites-available/sudo nano default Place the following configuration inside: upstream application { server 10.2.2.11; # IP addresses of the servers to distribute requests between server 10.2.2.12; server 10.2.2.13; } server { listen 80; # Nginx will open on this port location / { # Specify where to redirect traffic from Nginx proxy_pass http://application; } } Setting Up Load Balancing in Nginx To configure load balancing in Nginx, you need to define two blocks in the configuration: upstream — Defines the server addresses between which the network traffic will be distributed. Here, you specify the IP addresses, ports, and, if necessary, load balancing methods. We will discuss these methods later. server — Defines how Nginx will receive requests. Usually, this includes the port, domain name, and other parameters. The proxy_pass path specifies where the requests should be forwarded. It refers to the upstream block mentioned earlier. In this way, Nginx is used not only as a load balancer but also as a reverse proxy. A reverse proxy is a server that sits between the client and backend application instances. It forwards requests from clients to the backend and can provide additional features such as SSL certificates, logging, and more. Load Balancing Methods Round Robin There are several methods for load balancing. By default, Nginx uses the Round Robin algorithm, which is quite simple. For example, if we have three applications (1, 2, and 3), the load balancer will send the first request to the first application, then the second request to the second application, the third request to the third application, and then continue the cycle, sending the next request to the first one again. Let’s look at an example. I have deployed two applications and configured load balancing with Nginx for them: upstream application { server 172.25.208.1:5002; # first server 172.25.208.1:5001; # second } Let’s see how this works in practice: The first request goes to the first server. The second request goes to the second server. Then it goes back to the first server, and so on. However, this algorithm has a limitation: backend instances may be idle simply because they are waiting for their turn. Round Robin with Weights To avoid idle servers, we can use numerical priorities. Each server gets a weight, which determines how much traffic will be directed to that specific application instance. This way, we ensure that more powerful servers will receive more traffic. In Nginx, the priority is specified using server weight as follows: upstream application { server 10.2.2.11 weight=5; server 10.2.2.12 weight=3; server 10.2.2.13 weight=1; } With this configuration, the server at address 10.2.2.11 will receive the most traffic because it has the highest weight. This approach is more reliable than the standard Round Robin, but it still has a drawback. We can manually specify weights based on server power, but requests can still differ in execution time. Some requests might be more complex and slower, while others are fast and lightweight. upstream application { server 172.25.208.1:5002 weight=3; # first server 172.25.208.1:5001 weight=1; # second } Least Connections What if we move away from Round Robin? Instead of simply distributing requests in order, we can base the distribution on certain parameters, such as the number of active connections to the server. The Least Connections algorithm ensures an even distribution of load between application instances by considering the number of active connections to each server. To configure it, simply add least_conn; in the upstream block: upstream application { least_conn; server 10.2.2.11; … } Let’s return to our example. To test how this algorithm works, I wrote a script that sends 500 requests concurrently and checks which application each request is directed to. Here is the output of that script: Additionally, this algorithm can be used together with weights for the addresses, similar to Round Robin. In this case, the weights will indicate the relative number of connections to each address — for example, with weights of 1 and 5, the address with a weight of 5 will receive five times more connections than the address with a weight of 1. Here’s an example of such a configuration: upstream application { least_conn; server 10.2.2.11 weight=5; … } nginx upstream loadbalancer { least_conn; server 172.25.208.1:5002 weight=3; # first server 172.25.208.1:5001 weight=1; # second } And here’s the output of the script: As we can see, the number of requests to the first server is exactly three times higher than to the second. IP Hash This method works based on the client’s IP address. It guarantees that all requests from a specific address will be routed to the same instance of the application. The algorithm calculates a hash of the client’s and server’s addresses and uses this result as a unique key for load balancing. This approach can be useful in blue-green deployment scenarios, where we update each backend version sequentially. We can direct all requests to the backend with the old version, then update the new one and direct part of the traffic to it. If everything works well, we can direct all users to the new backend version and update the old one. Example configuration: upstream app { ip_hash; server 10.2.2.11; … } With this configuration, in our example, all requests will now go to the same application instance: Error Handling When configuring a load balancer, it's also important to detect server failures and, if necessary, stop directing traffic to "down" application instances. To allow the load balancer to mark a server address as unavailable, you must define additional parameters in the upstream block: failed_timeout and max_fails. failed_timeout: This parameter specifies the amount of time during which a certain number of connection errors must occur for the server address in the upstream block to be marked as unavailable. max_fails: This parameter sets the number of connection errors allowed before the server is considered "down." Example configuration: upstream application { server 10.2.0.11 max_fails=2 fail_timeout=30s; … } Now, let's see how this works in practice. We will "take down" one of the test backends and add the appropriate configuration. The first backend instance from the example is now disabled. Nginx redirects traffic only to the second server. Comparative Table of Traffic Distribution Algorithms Algorithm Pros Cons Round Robin Simple and lightweight algorithm. Evenly distributes load across applications. Scales well. Does not account for server performance differences. Does not consider the current load of applications. Weighted Round Robin Allows setting different weights for servers based on performance. Does not account for the current load of applications. Manual weight configuration may be required. Least Connection Distributes load to applications with the fewest active connections. Can lead to uneven load distribution with many slow clients. Weighted Least Connection Takes server performance into account by focusing on active connections. Distributes load according to weights and connection count. Manual weight configuration may be required. IP Hash Ties the client to a specific IP address. Ensures session persistence on the same server. Does not account for the current load of applications. Does not consider server performance. Can result in uneven load distribution with many clients from the same IP. Conclusion In this article, we explored the topic of load balancing. We learned about the different load balancing methods available in Nginx and demonstrated them with examples.
18 November 2024 · 9 min to read
Servers

Sentry: Error Tracking and Monitoring

Sentry is a platform for error logging and application monitoring. The data we receive in Sentry contains comprehensive information about the context in which an issue occurred, making it easier to reproduce, trace the root cause, and significantly assist in error resolution. It's a valuable tool for developers, testers, and DevOps professionals. This open-source project can be deployed on a private or cloud server. Originally, Sentry was a web interface for displaying traces and exceptions in an organized way, grouping them by type. Over time, it has grown, adding new features, capabilities, and integrations. It's impossible to showcase everything it can do in a single article fully, and even a brief video overview could take up to three hours. Official Website  Documentation  GitHub Why Use Sentry When We Have Logging? Reviewing logs to understand what's happening with a service is helpful. When logs from all services are centralized in one place, like Elastic, OpenSearch, or Loki, it’s even better. However, you can analyze errors and exceptions faster, more conveniently, and with greater detail in Sentry. There are situations when log analysis alone does not clarify an issue, and Sentry comes to the rescue. Consider cases where a user of your service fails to log in, buy a product, or perform some other action and leaves without submitting a support ticket. Such issues are extremely difficult to identify through logs alone. Even if a support ticket is submitted, analyzing, identifying, and reproducing such specific errors can be costly: What device and browser were used? What function triggered the error, and why? What specific error occurred? What data was on the front end, and what was sent to the backend? Sentry’s standout feature is the way it provides detailed contextual information about errors in an accessible format, enabling faster response and improved development. As the project developers claim on their website, “Your code will tell you more than what logs reveal. Sentry’s full-stack monitoring shows a more complete picture of what's happening in your service’s code, helping identify issues before they lead to downtime.” How It Works In your application code, you set up a DSN (URL) for your Sentry platform, which serves as the destination for reports (errors, exceptions, and logs). You can also customize, extend, or mask the data being sent as needed. Sentry supports JavaScript, Node, Python, PHP, Ruby, Java, and other programming languages. In the setup screenshot, you can see various project types, such as a basic Python project as well as Django, Flask, and FastAPI frameworks. These frameworks offer enhanced and more detailed data configurations for report submission. Usage Options Sentry offers two main usage options: Self-hosted (deployed on your own server) Cloud-based (includes a limited free version and paid plans with monthly billing) The Developer version is a free cloud plan suitable for getting acquainted with Sentry. For anyone interested in Sentry, we recommend at least trying the free cloud version, as it’s a good introduction. However, a self-hosted option is ideal since the cloud version can experience error reporting delays of 1 to 5 minutes, which may be inconvenient. Self-Hosted Version Installation Now, let's move on to the technical part. To deploy Sentry self-hosted, we need the getsentry/self-hosted repository. The platform will be set up using Docker Compose. System Requirements Docker 19.03.6+ Docker Compose 2.19.0+ 4 CPU cores 16 GB RAM 20 GB free disk space We’ll be using a VPS from Hostman with Ubuntu 22.04. System Setup Update Dependencies First, we need to update the system packages: apt update && apt upgrade -y Install Required Packages Docker Docker's version available in the repository is 24.0.7, so we’ll install it with: apt install docker.io Docker Compose The version offered by apt is 1.29.2-1, which does not match the required version. So we need to install in manully. We’ll get the latest version directly from the official repository: VERSION=$(curl --silent https://api.github.com/repos/docker/compose/releases/latest | grep -Po '"tag_name": "\K.*\d')DESTINATION=/usr/bin/docker-composesudo curl -L https://github.com/docker/compose/releases/download/${VERSION}/docker-compose-$(uname -s)-$(uname -m) -o $DESTINATIONsudo chmod 755 $DESTINATION Verify Docker Compose Installation To ensure everything is correctly installed, check the version of Docker Compose: docker-compose --version Output: Docker Compose version v2.20.3 Once these steps are completed, you can proceed with deploying Sentry using Docker Compose. Installation The Sentry developers have simplified the installation process with a script. Here's how to set it up: Clone the Repository and Release Branch First, clone the repository and checkout the release branch: git clone https://github.com/getsentry/self-hosted.gitcd self-hostedgit checkout 24.10.0 Run the Installation Script Start the installation process by running the script with the following flags: ./install.sh --skip-user-prompt --no-report-self-hosted-issues Flags explanation: --skip-user-prompt: Skips the prompt for creating a user (we’ll create the user manually, which can be simpler). --no-report-self-hosted-issues: Skips the prompt to send anonymous data to the Sentry developers from your host (this helps developers improve the product, but it uses some resources; decide if you want this enabled). The script will check system requirements and download the Docker images (docker pull). Start Sentry Once the setup is complete, you’ll see a message with the command to run Sentry: You're all done! Run the following command to get Sentry running:docker-compose up -d Run the command to start Sentry: docker-compose up -d The Sentry web interface will now be available at your host's IP address on port 9000. Before your first login, edit the ./sentry/config.yml configuration file and the line: system.url-prefix: 'http://server_IP:9000' And restart the containers: docker-compose restart Create a User We skipped the user creation during the installation, so let’s create the user manually. Run: docker-compose run --rm web createuser Enter your email, password, and answer whether you want to give the user superuser privileges. Upon first login, you’ll see an initial setup screen where you can specify: The URL for your Sentry instance. Email server settings for sending emails. Whether to allow other users to self-register. At this point, Sentry is ready to use. You can read more about the configuration here. Configuration Files Sentry’s main configuration files include: .env./sentry/config.yml./sentry/sentry.conf.py By default, 42 containers are launched, and we can customize settings in the configuration files. Currently, it is not possible to reduce the number of containers due to the complex architecture of the system.  You can modify the .env file to disable some features. For example, to disable the collection of private statistics, add this line to .env: SENTRY_BEACON=False You can also change the event retention period. By default, it is set to 90 days: SENTRY_EVENT_RETENTION_DAYS=90 Database and Caching Project data and user accounts are stored in PostgreSQL. If needed, you can easily configure your own database and Redis in the configuration files. HTTPS Proxy Setup To access the web interface securely, you need to set up an HTTPS reverse proxy. The Sentry documentation does not specify a particular reverse proxy, but you can choose any that fits your needs. After configuring your reverse proxy, you will need to update the system.url-prefix in the config.yml file and adjust the SSL/TLS settings in sentry/sentry.conf.py. Project Setup and Integration with Sentry To set up and connect your first project with Sentry, follow these steps: Create a New Project In the Sentry web interface, click Add New Project and choose your platform. After creating the project, Sentry will generate a unique DSN (Data Source Name), which you'll need to use in your application to send events to Sentry. Configure the traces_sample_rate Pay attention to the traces_sample_rate setting. It controls the percentage of events that are sent to Sentry. The default value is 1.0, which sends 100% of all events.  traces_sample_rate=1.0  # 100% of events will be sent If you set it to 0.25, it will only send 25% of events, which can be useful to avoid overwhelming the platform with too many similar errors. You can adjust this value depending on your needs. You can read more about additional parameters of the sentry_sdk in the official documentation. Example Code with Custom Exception Here’s an example script that integrates Sentry with a custom exception and function: import sentry_sdk sentry_sdk.init( dsn="http://[email protected]:9000/3", # DSN from project creation traces_sample_rate=1.0, # Send 100% of events environment="production", # Set the runtime environment release="my-app-1.0.0", # Specify the app version send_default_pii=True, # Send Personally Identifiable Information (PII) ) class MyException(Exception): pass def my_function(user, email): raise MyException(f"User {user} ({email}) encountered an error.") def create_user(): print("Creating a user...") my_function('James', '[email protected]') if __name__ == "__main__": sentry_sdk.capture_message("Just a simple message") # Send a test message to Sentry create_user() # Simulate the error Run the Script Run the Python script: python main.py This script will: Initialize Sentry with your project’s DSN. Capture a custom exception when calling my_function. Send an example message to Sentry. Check Results in Sentry After running the script, you should see the following in Sentry: The Just a simple message message will appear in the event stream. The MyException that is raised in my_function will be captured as an error, and the details of the exception will be logged. You can also view the captured exception, including the user information (user and email) and any other data you choose to send (such as stack traces, environment, etc.). In Sentry, the tags displayed in the error reports include important contextual information that can help diagnose issues. These tags often show: Environment Variable: This indicates the runtime environment of the application, such as "production", "development", or "staging". It helps you understand which environment the error occurred in. Release Version: The version of your application that was running when the error occurred. This is particularly useful for identifying issues that might be specific to certain releases or versions of the application. Hostname: The name of the server or machine where the error happened. This can be helpful when working in distributed systems or multiple server environments, as it shows the exact server where the issue occurred. These tags appear in the error reports, providing valuable context about the circumstances surrounding the issue. For example, the stack trace might show which functions were involved in the error, and these tags can give you additional information, such as which version of the app was running and on which server, making it easier to trace and resolve issues. Sentry automatically adds these contextual tags, but you can also customize them by passing additional information when you capture errors, such as environment, release version, or user-related data. Conclusion In this article, we discussed Sentry and how it can help track errors and monitor applications. We hope it has sparked your interest enough to explore the documentation or try out Sentry. Despite being a comprehensive platform, Sentry is easy to install and configure. The key is to carefully manage errors and group events and use flexible configurations to avoid chaos. When set up properly, Sentry becomes a powerful and efficient tool for development teams, offering valuable insights into application behavior and performance.
15 November 2024 · 10 min to read
Ubuntu

How to Install VNC on Ubuntu

If you need to interact with a remote server through a graphical interface, you can use VNC technology.VNC (Virtual Network Computing) allows users to establish a remote connection to a server over a network. It operates on a client-server architecture and uses the RFB protocol to transmit screen images and input data from various devices (such as keyboards or mice). VNC supports multiple operating systems, including Ubuntu, Windows, macOS, and others. Another advantage of VNC is that it allows multiple users to connect simultaneously, which can be useful for collaborative work on projects or training sessions. In this guide, we will describe how to install VNC on Ubuntu, using a Hostman cloud server with Ubuntu 22.04 as an example. Step 1: Preparing to Install VNC Before starting the installation process on both the server and the local machine, there are a few prerequisites to review.  Here is a list of what you’ll need to complete the installation: A Server Running Ubuntu 22.04. In this guide, we will use a cloud server from Hostman with minimal hardware configuration. A User with sudo Privileges. You should perform the installation as a regular user with administrative privileges. Select a Graphical Interface. You’ll need to choose a desktop environment that you will use to interact with the remote server after installing the system on both the server and the local machine. A Computer with a VNC Client Installed.  Currently, the only way to communicate with a rented server running Ubuntu 22.04 is through the console. To enable remote management via a graphical interface, you’ll need to install a desktop environment along with VNC on the server. Below are lists of available VNC servers and desktop environments that can be installed on an Ubuntu server. VNC Servers: TightVNC Server. One of the most popular VNC servers for Ubuntu. It is easy to set up and offers good performance. RealVNC Server. RealVNC provides a commercial solution for remote access to servers across various Linux distributions, including Ubuntu, Debian, Fedora, Arch Linux, and others. Desktop Environments: Xfce. A lightweight and fast desktop environment, ideal for remote sessions over VNC. It uses fewer resources than heavier desktop environments, making it an excellent choice for servers and virtual machines. GNOME. The default Ubuntu desktop environment, offering a modern and user-friendly interface. It can be used with VNC but will consume more resources than Xfce. KDE Plasma. Another popular desktop environment that provides a wide range of features and a beautiful design. The choice of VNC server and desktop environment depends on the user’s specific needs and available resources. TightVNC and Xfce are excellent options for stable remote sessions on Ubuntu, as they do not require high resources. In the next step, we will describe how to install them on the server in detail. Step 2: Installing the Desktop Environment and VNC Server To install the VNC server on Ubuntu along with the desktop environment, connect to the server and log in as a regular user with administrative rights. Update the Package List  After logging into the server, run the following command to update the packages from the connected repositories: sudo apt update Install the Desktop Environment  Next, install the previously selected desktop environment. To install Xfce, enter: sudo apt install xfce4 xfce4-goodies Here, the first package provides the basic Xfce desktop environment, while the second includes additional applications and plugins for Xfce, which are optional. Install the TightVNC Server  To install TightVNC, enter: sudo apt install tightvncserver Start the VNC Server  Once the installation is complete, initialize the VNC server by typing: vncserver This command creates a new VNC session with a specific session number, such as :1 for the first session, :2 for the second, and so on. This session number corresponds to a display port (for example, port 5901 corresponds to :1). This allows multiple VNC sessions to run on the same machine, each using a different display port. During the first-time setup, this command will prompt you to set a password, which will be required for users to connect to the server’s graphical interface. Set the View-Only Password (Optional)  After setting the main password, you’ll be prompted to set a password for view-only mode. View-only mode allows users to view the remote desktop without making any changes, which is helpful for demonstrations or when limited access is needed. If you need to change the passwords set above, use the following command: vncpasswd Now you have a VNC session. In the next step, we will set up VNC to launch the Ubuntu server with the installed desktop environment. Step 3: Configuring the VNC Server The VNC server needs to know which desktop environment it should connect to. To set this up, we’ll need to edit a specific configuration file. Stop Active VNC Instances  Before making any configurations, stop any active VNC server instances. In this guide, we’ll stop the instance running on display port 5901. To do this, enter: vncserver -kill :1 Here, :1 is the session number associated with display port 5901, which we want to stop. Create a Backup of the Configuration File  Before editing, it’s a good idea to back up the original configuration file. Run: mv ~/.vnc/xstartup ~/.vnc/xstartup.bak Edit the Configuration File  Now, open the configuration file in a text editor: nano ~/.vnc/xstartup Replace the contents with the following: #!/bin/bashxrdb $HOME/.Xresourcesstartxfce4 & #!/bin/bash – This line is called a "shebang," and it specifies that the script should be executed using the Bash shell. xrdb $HOME/.Xresources – This line reads settings from the .Xresources file, where desktop preferences like colors, fonts, cursors, and keyboard options are stored. startxfce4 & – This line starts the Xfce desktop environment on the server. Make the Configuration File Executable To allow the configuration file to be executed, use: chmod +x ~/.vnc/xstartup Start the VNC Server with Localhost Restriction Now that the configuration is updated, start the VNC server with the following command: vncserver -localhost The -localhost option restricts connections to the VNC server to the local host (the server itself), preventing remote connections from other machines. You will still be able to connect from your computer, as we’ll set up an SSH tunnel between it and the server. These connections will also be treated as local by the VNC server. The VNC server configuration is now complete. Step 4: Installing the VNC Client and Connecting to the Server Now, let’s proceed with installing a VNC client. In this example, we’ll install the client on a Windows 11 computer. Several VNC clients support different operating systems. Here are a few options:  RealVNC Viewer. The official client from RealVNC, compatible with Windows, macOS, and Linux. TightVNC Viewer. A free and straightforward VNC client that supports Windows and Linux. UltraVNC. Another free VNC client for Windows with advanced remote management features. For this guide, we’ll use the free TightVNC Viewer. Download and Install TightVNC Viewer Visit the official TightVNC website, download the installer, and run it. In the installation window, click Next and accept the license agreement. Then, select the custom installation mode and disable the VNC server installation, as shown in the image below. Click Next twice and complete the installation of the VNC client on your local machine. Set Up an SSH Tunnel for Secure Connection To encrypt your remote access to the VNC server, use SSH to create a secure tunnel. On your Windows 11 computer, open PowerShell and enter the following command: ssh -L 56789:localhost:5901 -C -N -l username server_IP_address Make sure that OpenSSH is installed on your local machine; if not, refer to Microsoft’s documentation to install it. This command configures an SSH tunnel that forwards the connection from your local computer to the remote server over a secure connection, making VNC believe the connection originates from the server itself. Here’s a breakdown of the flags used: -L sets up SSH port forwarding, redirecting the local computer’s port to the specified host and server port. Here, we choose port 56789 because it is not bound to any service. -C enables compression of data before transmitting over SSH. -N tells SSH not to execute any commands after establishing the connection. -l specifies the username for connecting to the server. Connect with TightVNC Viewer After creating the SSH tunnel, open the TightVNC Viewer and enter the following in the connection field: localhost:56789 You’ll be prompted to enter the password created during the initial setup of the VNC server. Once you enter the password, you’ll be connected to the VNC server, and the Xfce desktop environment should appear. Stop the SSH Tunnel To close the SSH tunnel, return to the PowerShell or command line on your local computer and press CTRL+C. Conclusion This guide has walked you through the step-by-step process of setting up VNC on Ubuntu 22.04. We used TightVNC Server as the VNC server, TightVNC Viewer as the client, and Xfce as the desktop environment for user interaction with the server. We hope that using VNC technology helps streamline your server administration, making the process easier and more efficient.
15 November 2024 · 8 min to read
Servers

How to Install Mattermost on Ubuntu

Mattermost is a messaging and collaboration platform that can be installed on self-hosted servers or in the cloud. It serves as an alternative to messengers like Slack and Rocket.Chat. In this guide, we will review the Free plan, which includes unlimited message history and group calls (for more details on pricing plans, see the official website). Mattermost clients are available for mobile (iOS, Android) and desktop (Windows, Linux, Mac), and there’s also a browser-based version. Only the Self-Hosted Mattermost version is available under the Free plan;  We will go through the installation on Ubuntu. Other installation methods (including a Docker image) are available in the official docs. Technical Requirements For 1,000 users, a minimum configuration of 1 CPU, 2 GB RAM, and PostgreSQL v11+ or MySQL 8.0.12+ is required. We will use the following resources: For PostgreSQL 16: We'll provision a DBaaS with 1 CPU, 1 GB RAM, and 20 GB of disk space. For Mattermost: We'll provision a server running Ubuntu with 2 CPUs, 2 GB RAM, and 60 GB of disk space. We will also need to restrict access to the database. We will do it by setting up a private network in Hostman. Environment Setup Creating a Private Network To restrict database access, we can use Firewall, but in this setup, all services will be within the same network.  Important: Services must be located in the same region to operate within a single network. Database We'll provision the database as a service with the following configuration: 1 CPU, 1 GB RAM, and 20 GB of disk space, hosted in Poland. While creating the database, in the Network section, select the No external IP option and the network created in the previous step. The default database is default_db, and the user is gen_user. Server for Mattermost Next, we need to set up a server for Mattermost and Nginx. This server will run Ubuntu 22.04 and will be hosted in Poland. For the configuration, we need at least 2 CPUs, 2 GB RAM, and 50 GB of disk space, so we will choose a close enough plan: You can also select the exact parameters (2 CPUs, 2 GB RAM, 50 GB) by using the Custom tab, but it will be more expensive. As with the PostgreSQL setup, select the previously created network in the Network step. Create the server. Domain We will also need a domain to obtain a TLS certificate. In this guide, we will use example.com. You can add your domain in the Domains → Add domain section in the Hostman control panel.  Ensure the domain is linked to the server. You can verify this in the Network section. If the domain is not listed next to the IP address, it can be added manually through the Set Up Reverse Zone option. Installing Mattermost Now that the environment is ready, we can proceed with installing Mattermost. To begin, we’ll connect to the repository at deb.packages.mattermost.com/repo-setup.sh: curl -o- https://deb.packages.mattermost.com/repo-setup.sh | sudo bash -s mattermost Here, the mattermost argument is passed to sudo bash -s mattermost to add only the Mattermost repository. If no argument is provided, the script’s default all argument will add repositories for Mattermost, Nginx, PostgreSQL, and Certbot. Installing the Service The Mattermost service will install to /opt/mattermost, with a mattermost user and group created automatically: sudo apt update sudo apt install mattermost -y After installation, create a config.json file with the necessary permissions, based on the config.defaults.json file. Read and write access should be granted only to the owner (in this case, the mattermost user): sudo install -C -m 600 -o mattermost -g mattermost /opt/mattermost/config/config.defaults.json /opt/mattermost/config/config.json Configuring Mattermost Open config.json to fill in key parameters: sudo nano /opt/mattermost/config/config.json Set the following: SiteURL: Enter the created domain with the https protocol in the ServiceSettings block, which will be linked with an SSL certificate later. "ServiceSettings": { "SiteURL": "https://example.com", "WebsocketURL": "" } DriverName: Ensure this is set to postgres in the SqlSettings block. DataSource: Provide the username, password, host, and database name in the connection link in the SqlSettings block. Other configurations are optional for the initial launch and can be modified later in the Mattermost administrative console. Starting Mattermost Start the Mattermost service: sudo systemctl start mattermost To verify that Mattermost started successfully: sudo systemctl status mattermost.service And verify it is accessible on port 8065. If the site doesn’t open, check the firewall settings. You can also verify local access to port 8065 directly from the server: curl -v localhost:8065 Enabling Auto-Start Finally, enable Mattermost to start automatically on boot: sudo systemctl enable mattermost.service With these steps, Mattermost should be up and running and ready for further configuration and usage. Setting Up Nginx as a Reverse Proxy for Mattermost We will set up Nginx as a reverse proxy to prevent direct access on port 8065, which will be closed later via firewall. Install Nginx: sudo apt install nginx Create the Nginx Configuration File: sudo nano /etc/nginx/sites-available/mattermost Nginx Configuration for Mattermost: Add the following configuration, replacing example.com with your actual domain name. This configuration proxies both HTTP and WebSocket protocols. upstream backend { server 127.0.0.1:8065; keepalive 32; } proxy_cache_path /var/cache/nginx levels=1:2 keys_zone=mattermost_cache:10m max_size=3g inactive=120m use_temp_path=off; server { listen 80; server_name example.com; location ~ /api/v[0-9]+/(users/)?websocket$ { proxy_set_header Upgrade $http_upgrade; proxy_set_header Connection "upgrade"; client_max_body_size 50M; proxy_set_header Host $http_host; proxy_set_header X-Real-IP $remote_addr; proxy_set_header X-Forwarded-For $proxy_add_x_forwarded_for; proxy_set_header X-Forwarded-Proto $scheme; proxy_set_header X-Frame-Options SAMEORIGIN; proxy_buffers 256 16k; proxy_buffer_size 16k; client_body_timeout 60; send_timeout 300; lingering_timeout 5; proxy_connect_timeout 90; proxy_send_timeout 300; proxy_read_timeout 90s; proxy_pass http://backend; } location / { client_max_body_size 50M; proxy_set_header Connection ""; proxy_set_header Host $http_host; proxy_set_header X-Real-IP $remote_addr; proxy_set_header X-Forwarded-For $proxy_add_x_forwarded_for; proxy_set_header X-Forwarded-Proto $scheme; proxy_set_header X-Frame-Options SAMEORIGIN; proxy_buffers 256 16k; proxy_buffer_size 16k; proxy_read_timeout 600s; proxy_cache mattermost_cache; proxy_cache_revalidate on; proxy_cache_min_uses 2; proxy_cache_use_stale timeout; proxy_cache_lock on; proxy_http_version 1.1; proxy_pass http://backend; } } Create a symbolic link to enable the Mattermost configuration: sudo ln -s /etc/nginx/sites-available/mattermost /etc/nginx/sites-enabled/mattermost Remove the default configuration: sudo rm -f /etc/nginx/sites-enabled/default Restart the Nginx service to apply the changes: sudo service nginx restart Setting Up SSL with Let’s Encrypt: Use Certbot to obtain an SSL certificate for your domain. Certbot will automatically configure Nginx for HTTPS. sudo apt install python3-certbot-nginx && certbot Certbot will prompt you to enter your email and domain name and then add the certificate to your domain. After installing the certificate, Certbot will update the Nginx configuration file to include: A listen directive for handling requests on port 443 (HTTPS) SSL keys and configuration directives A redirect from HTTP to HTTPS With this setup complete, Mattermost should be accessible over HTTPS on your domain. Nginx will handle HTTP to HTTPS redirection, and secure connections will be established using the SSL certificate from Let’s Encrypt. Setting Up Firewall Now, go to your Mattermost server page in the Hostman control panel. Open the Network tab to add firewall rules. We will allow incoming TCP requests to ports 22 for SSH access, and 80 and 443 for TCP.  To collect metrics on the server dashboard, port 10050 also needs to be open; the list of IP addresses that require access to this port can be found in /etc/zabbix/zabbix_agentd.conf. First Launch Now you can Mattermost at https://your_domain/. You can create an account and workspace directly in the browser. After installation and on the first login, you may encounter an issue with WebSocket connectivity. To solve it, check the configuration. You can do it in the System Console. Out-of-the-box features include calls, playbooks, a plugin marketplace, and GitLab authentication. Additionally, Mattermost offers excellent documentation. Conclusion In this guide, we deployed the free self-hosted version of Mattermost on Hostman servers with a dedicated database accessible only from the internal network. Keep in mind that we allocated the server resources for a general scenario, so you may need additional resources. It’s advisable not to skip load testing! As a next step, I recommend connecting an S3 storage, also available on Hostman.
14 November 2024 · 8 min to read
Ubuntu

How To Install Webmin on Ubuntu 24.04

Managing a Linux server can be challenging, particularly when dealing with standard duties like system monitoring, service configuration, and user administration. Despite its strength, command-line management necessitates knowledge of Linux commands and setups, which might be difficult for novice admins. Webmin offers a solution that simplifies these tasks and makes server management possible even for people without a lot of Linux experience thanks to its intuitive, web-based user interface. This article offers a thorough, step-by-step tutorial that starts with the required package updates and progresses through the installation of dependencies, repository settings, and secure access setup. Every component has been thoughtfully created to guarantee that customers fully comprehend the installation procedure as well as the security issues at play.. After the successful installation of Webmin, a versatile and user-friendly tool will be available to readers to manage their Ubuntu server directly from a web browser. Webmin gives users the ability to easily and effectively utilize critical server administration activities, such as setting up network services, creating and maintaining user accounts, and keeping an eye on system health. Even with little knowledge of Linux command-line interfaces, users may confidently manage servers by following this guide, which will enable users to make the most of the Linux environment. Prerequisites The requirements to install Webmin on Ubuntu 24.04 are as follows: A local computer or a cloud server with Ubuntu 24.04 installed A regular user with sudo access. Since installing Webmin requires downloading packages from external repositories, make sure the server has access to the internet. Make a new DNS record with a subdomain that points to the IP address of the server that hosts it. Take mywebmin.mydomain.com, for instance. Install Webmin Here are the step-by-step instructions for installing Webmin on Ubuntu 24.04. It is advised to upgrade any outdated packages and update the system's package lists first. This guarantees a trouble-free installation of Webmin and its dependencies. Execute the subsequent commands: sudo apt update && sudo apt upgrade -y Add Webmin repository. Users must manually add the Webmin repository because it is not part of the official Ubuntu repositories. Get the Webmin repository's GPG key by running the command below. wget -qO - http://www.webmin.com/jcameron-key.asc | sudo apt-key add - Include the Webmin repository to the system’s sources list. sudo sh -c 'echo "deb http://download.webmin.com/download/repository sarge contrib" > /etc/apt/sources.list.d/webmin.list' To establish the newly added repository, refresh the package list after adding it. sudo apt update Install Webmin now using: sudo apt install webmin -y After installation is finished, you can use a web browser to access Webmin. Open the web browser and navigate to this page: http://<server-ip>:10000 In our case, the IP address is 166.1.227.224: http://166.1.227.224:10000 Secure Webmin Update the SSL Webmin configuration. For encrypted connections, Webmin uses SSL by default; however, users must confirm this configuration. Open the Webmin configuration file in order to verify or enable SSL. Run the command below. sudo nano /etc/webmin/miniserv.conf Search the line with port=10000 and change it to another port. For example: Save your modifications and restart Webmin. sudo systemctl restart webmin Restricting access to specific IP addresses improves security by restricting the devices that can access Webmin. In order to view or change the allowed IPs, open the Webmin startup file and run the command below. sudo nano /etc/webmin/miniserv.conf In order to include only trusted IP addresses, change the allow= line. If it doesn’t exist yet, add it. allow=your_trusted_ip The actual IP address should be substituted for your_trusted_ip. One can add more than one address, with spaces between them. Restart Webmin after saving the file. sudo systemctl restart webmin Set Up Firewall Rules If a firewall is present, configure it; Webmin uses port 10000 by default. If the system has a firewall installed, such as UFW, grant Webmin access with the following steps. Check Firewall Status First, confirm that the UFW firewall is active. Run the following command to view the current status. sudo ufw status If the firewall isn't yet activated, use the command ufw enable to turn it on., but make sure to allow SSH service first to prevent the current session from terminating and being able to SSH to the server again. To allow the SSH service, run the following command.  sudo ufw allow ssh Run the following command to activate the firewall.  sudo ufw enable By default, Webmin uses port 10000. To allow traffic on this port, use the following command. sudo ufw allow 10000/tcp If Webmin is configured to use a custom port, try using a different port number instead of 10000. Grant access, for example, by using the following command  if Webmin is to set up on port 22000. sudo ufw allow 22000/tcp Limit Individual IP addresses' access. Increase Webmin's security by configuring the firewall to only allow access from specific, verified IP addresses. To limit access to 192.168.1.100, for example, run the command below. sudo ufw allow from 192.168.1.100 to any port 10000 proto tcp Repeat this command for each additional IP address that requires access. To ensure that the changes take effect when the rules are specified, reload UFW by running the following command. sudo ufw reload Check the firewall's status once again to ensure that the rules are in place. sudo ufw status Access Webmin Launch any current web browser, such Edge, Firefox, or Chromeweb, to access the Webmin interface after installing Webmin and setting up firewall rules. Enter the IP address of the server in the address bar, then Webmin's port (10000 by default or your custom port if you reconfigured): https:/<server-ip>/:10000. For example: https://166.1.227.224:10000 Because Webmin's default SSL certificate is self-signed, the browser can show a security warning if it is applied. Users should choose "Accept the Risk" or "Proceed to Site" in order to continue to Webmin. Enter the root username and password of the server, or any other account with sudo rights, to access the dashboard once the Webmin login screen is displayed. After successfully logging in, users will be taken to the Webmin dashboard, where they may manage users, monitor services, adjust settings, access a variety of system administration tools, and perform any other tasks related to administration on the Ubuntu server. Conclusion In conclusion, setting up Webmin on Ubuntu 24.04 offers a stable, intuitive interface for handling server responsibilities, enabling system management to be used by both inexperienced and seasoned users. Users may easily install, secure, and use Webmin by following this guide. This gives them the power to manage users, services, firewall settings, and more from a single online interface. By enabling administrators to carry out necessary operations in a convenient and efficient manner, Webmin improves server management efficiency and security.
14 November 2024 · 6 min to read

Tailored cloud server
solutions for every need

General-purpose cloud servers for web hosting

Ideal for websites, content management systems, and basic business applications, cloud web servers provide balanced performance with reliable uptime. These servers are designed to handle moderate traffic while keeping your website or application responsive.

High-performance servers for cloud computing


For businesses needing powerful resources for tasks like AI, machine learning, or data analysis, our high-performance cloud servers are built to process large datasets efficiently. Equipped with 3.3 GHz processors and high-speed NVMe storage, they ensure smooth execution of even the most demanding applications.

Storage-optimized cloud servers for data-driven operations

Need to store and retrieve large amounts of data? Our cloud data servers offer vast capacity with superior read/write speeds. These servers are perfect for databases, large-scale backups, or big data management, ensuring fast access to your data when you need it.

Memory-Optimized Servers for Heavy Workloads


These servers are built for applications that require high memory capacity, such as in-memory databases or real-time analytics. With enhanced memory resources, they ensure smooth handling of large datasets, making them ideal for businesses with memory-intensive operations.

In-depth answers to your questions

Which operating systems are supported on your cloud servers?

Choose popular server operating systems and deploy them in one click: from Ubuntu to CentOS. Licensed operating systems are available directly in the control panel.

How can I get started with a cloud server? Is there a straightforward registration process?

Register with Hostman and choose the tariff that suits your needs and requirements. You can always add processing power and purchase additional services if needed.

You don't need a development team to start shared hosting - you'll do everything yourself in a convenient control panel. Even a person with no technical background can easily work with it.

What is the minimum and maximum resource allocation (CPU, RAM, storage) available for cloud servers?

The starter package includes a 1×1.28 GHz 1-core CPU, 1 GB RAM, 15 GB fast MVNe SSD, dedicated IP address and 200 Mbps. For demanding users, go for a powerful 8×3.3 GHz server, 16 GB RAM, 160 GB fast MVNe SSD, dedicated IP address and 200 Mbps. Alternatively, you can always get an incredibly powerful server by configuring it yourself.

What scaling options are available for cloud servers?

You can easily add power, bandwidth, and channel width with just a few clicks directly in the control panel. With Hostman, you can enhance all the important characteristics of your server with hourly billing.

How much does a cloud server cost, and what is the pricing structure like?

Add capacity, bandwidth and channel width with a few clicks right in the control panel. With Hostman, you can improve all important features of your server - with hourly billing.

Is there a trial or testing period available for cloud servers before purchasing?

Contact the friendly Hostman support team, and they will offer you comfortable conditions for test-driving our cloud server — and will transfer your current projects to the cloud for free.

What security measures and data protection are in place for cloud servers?

Cloud servers are hosted in a Tier III data center with a high level of reliability. Hostman guarantees 99.99% availability according to the SLA, with downtime not exceeding 52 minutes per year. Additionally, data is backed up for extra security, and the communication channel is protected against DDoS attacks.

What level of support is provided for cloud servers?

Hostman support is always available, 7 days a week, around the clock. We respond to phone calls within a minute and chat inquiries within 15 minutes. Your questions will always be handled by knowledgeable staff with sufficient authority and technical background.

Can I install my own software on a cloud server?

Yes, absolutely! You can deploy any software, operating systems, and images you desire on your server. Everything is ready for self-configuration.

What backup and data recovery methods are available for cloud servers?

Hostman takes care of the security of your data and backs up important information. Additionally, you can utilize the automatic backup service for extra safety and reliability.

Is there a guaranteed Service Level Agreement (SLA) for cloud server availability?

Hostman guarantees a 99.99% level of virtual server availability according to the SLA (Service Level Agreement).

Which data center locations are available for hosting cloud servers?

Our servers are located in a modern Tier III data center in the European Union and the United States.

Can I create and manage multiple cloud servers under a single account?

Certainly, you can launch multiple cloud servers and other services (such as databases) within a single account.

What is the deployment time for cloud servers after ordering?

With Hostman, you'll get a service that is easy and quick to manage on your own. New cloud servers can be launched almost instantly from the control panel, and the necessary software can be installed within minutes.

What monitoring and notification capabilities are offered for cloud servers?

Hostman specialists monitor the technical condition of servers and software around the clock. You won't have to worry about server availability — it will simply work, always.

Can I modify the specifications of my cloud server (e.g., increase RAM) after creation?

You can easily configure your server by adding resources directly in the control panel. And if you need to switch to lower-tier plans, you can rely on Hostman support — our specialists will handle everything for you.

Do you have questions,
comments, or concerns?

Our professionals are available to assist you at any moment,
whether you need help or are just unsure of where to start
Email us
Hostman's Support